12. 7. Outliers
DSTND Course4 Lesson1 A9 Outliers
_ Tips for Finding the Seventh Data Story Type - Outliers:_
It can be fairly easy to spot outliers in a data set you’re exploring, because by definition outliers stick out like a sore thumb. It’s virtually impossible to spot them by glancing at even small tables, but there’s no easier way to uncover them than by creating charts and graphs and looking at the fringe cases.
Some useful chart types for finding outliers:
Simple timelines can reveal huge spikes in single variables
Scatterplots let you see how combinations of two variables can be dramatically different for specific elements
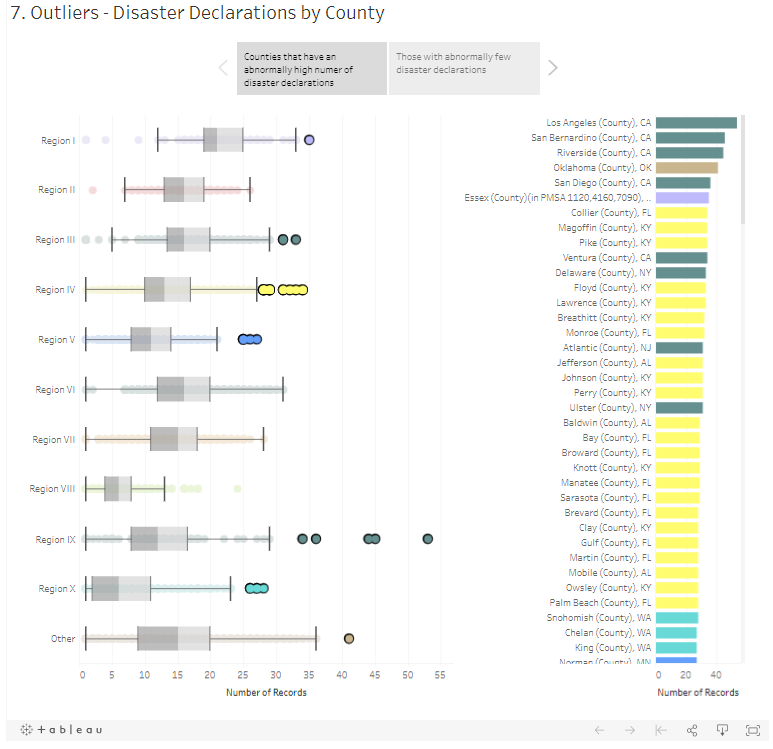
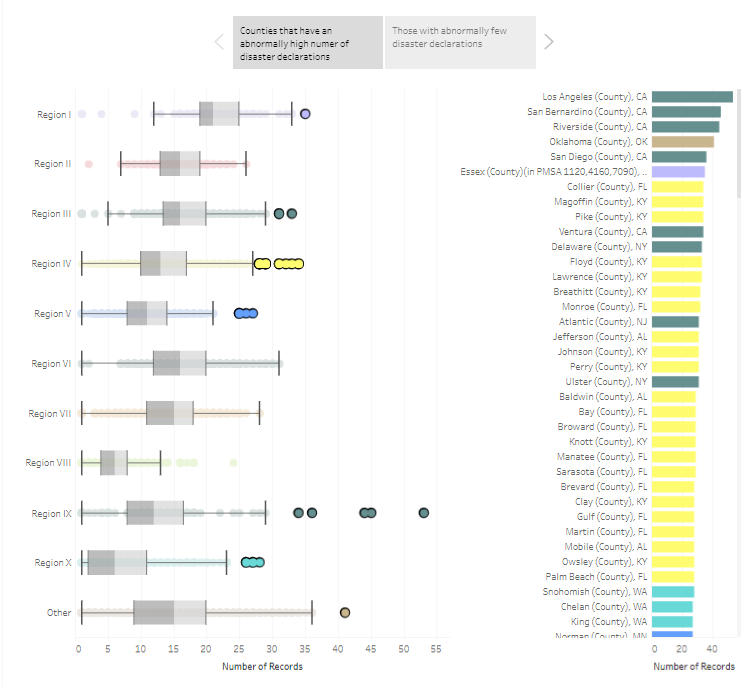
Statistical charts like histograms or box-and-whisker plots can make it easy to see odd occurrences
Visualize away, and ask yourself - which element or group in my data is quite different than its neighbors or peers?